Oracle performance · Open source
Harry in production.
The database was slow 20 minutes ago. Now it’s fine. What happened?
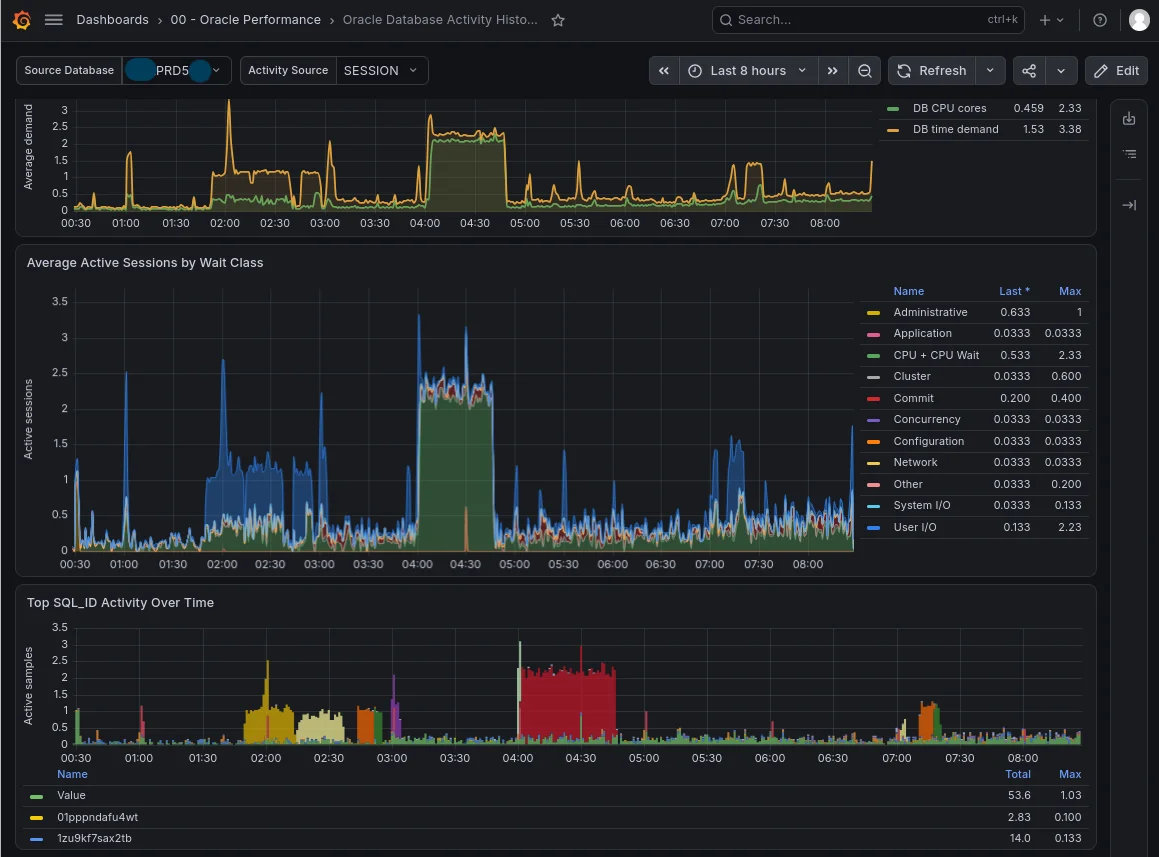
I built Harry so I could go back and see what Oracle was actually doing. It keeps SQL, sessions, waits and blocking in PostgreSQL, where I can investigate them in Grafana or query them directly.
What I wanted to keep
I wanted to see the SQL, the sessions running it and what they were waiting for when the problem happened. The original question was simple: can I still see what was happening once the incident is over?
What happened in production
In one deployment, Harry was configured for 45 Oracle databases across three locations. Twelve physical standbys were unreachable by the monitoring user and were quarantined by Harry’s dead-connection handling. Collection continued for the rest. In that deployment, the activity collector phase peaked below 70 ms.
A reader also asked what happens when the target database is already under heavy load. While looking at the scheduler to answer that, I found collector-health signals I could make visible, including scheduling lag and missed collection intervals. That question made Harry better.